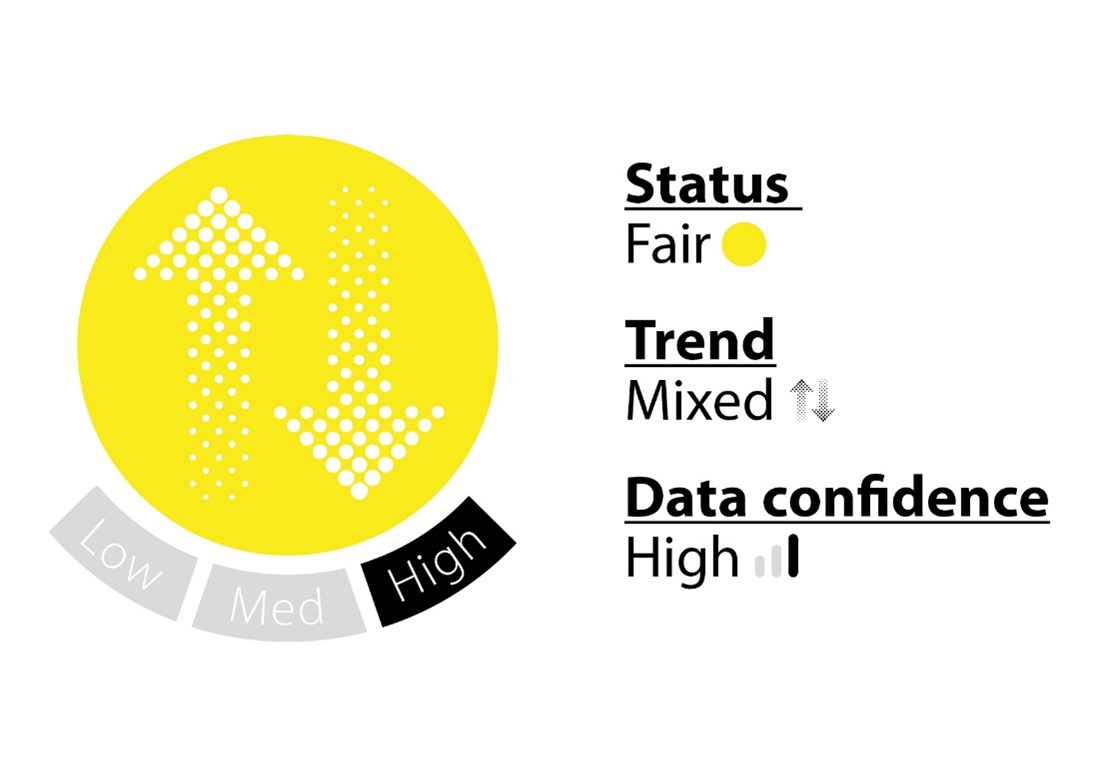
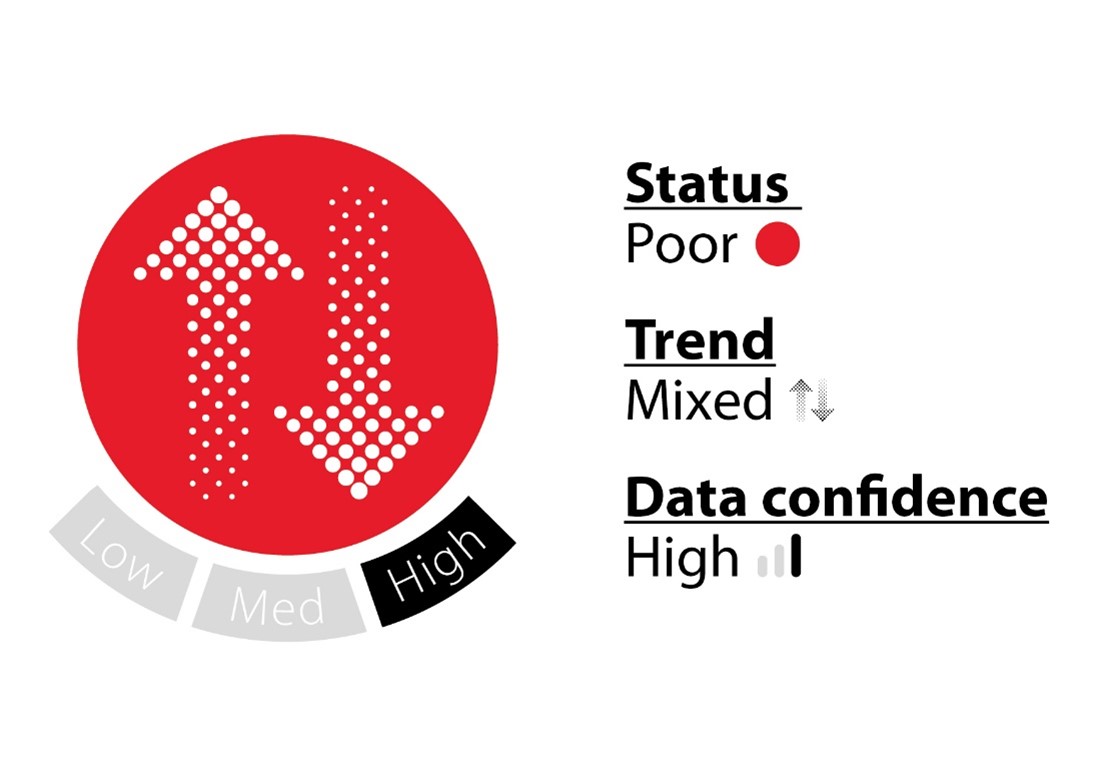
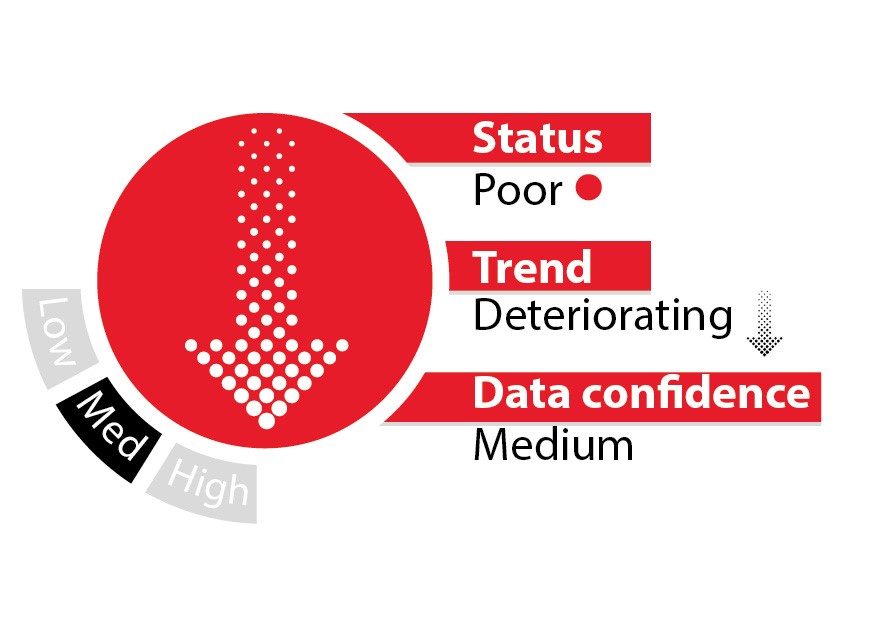
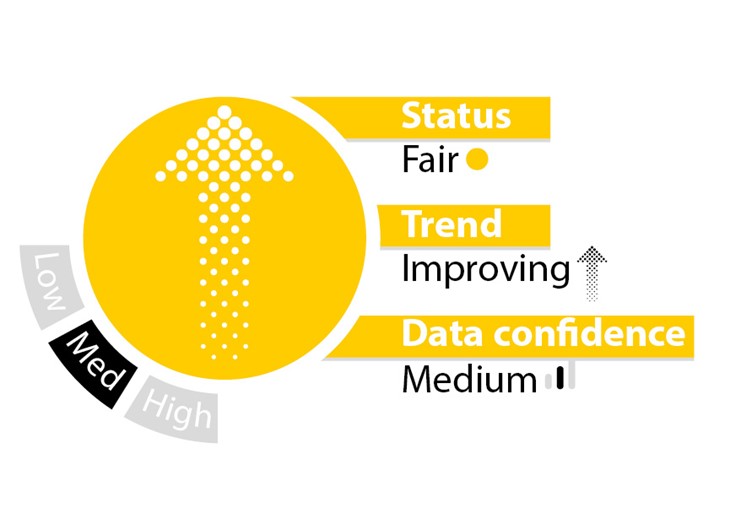
The Tuvalu State of Environment Report presents an overview across four thematic areas: Environmental Governance, Island and Ocean Ecosystems, Climate Change, and Waste. The report uses the ‘Drivers, Pressures, State, Impact and Response’ model to describe the environment. As far as possible the report is based on quantitative data relating to the state of the environment, supplemented by stakeholder input to describe causal relationships and environmental effects. The report presents:
While challenges to effective environmental governance remain, significant efforts are being made by the Government of Tuvalu to provide adequate resources, comply with international obligations and implement national legislation.
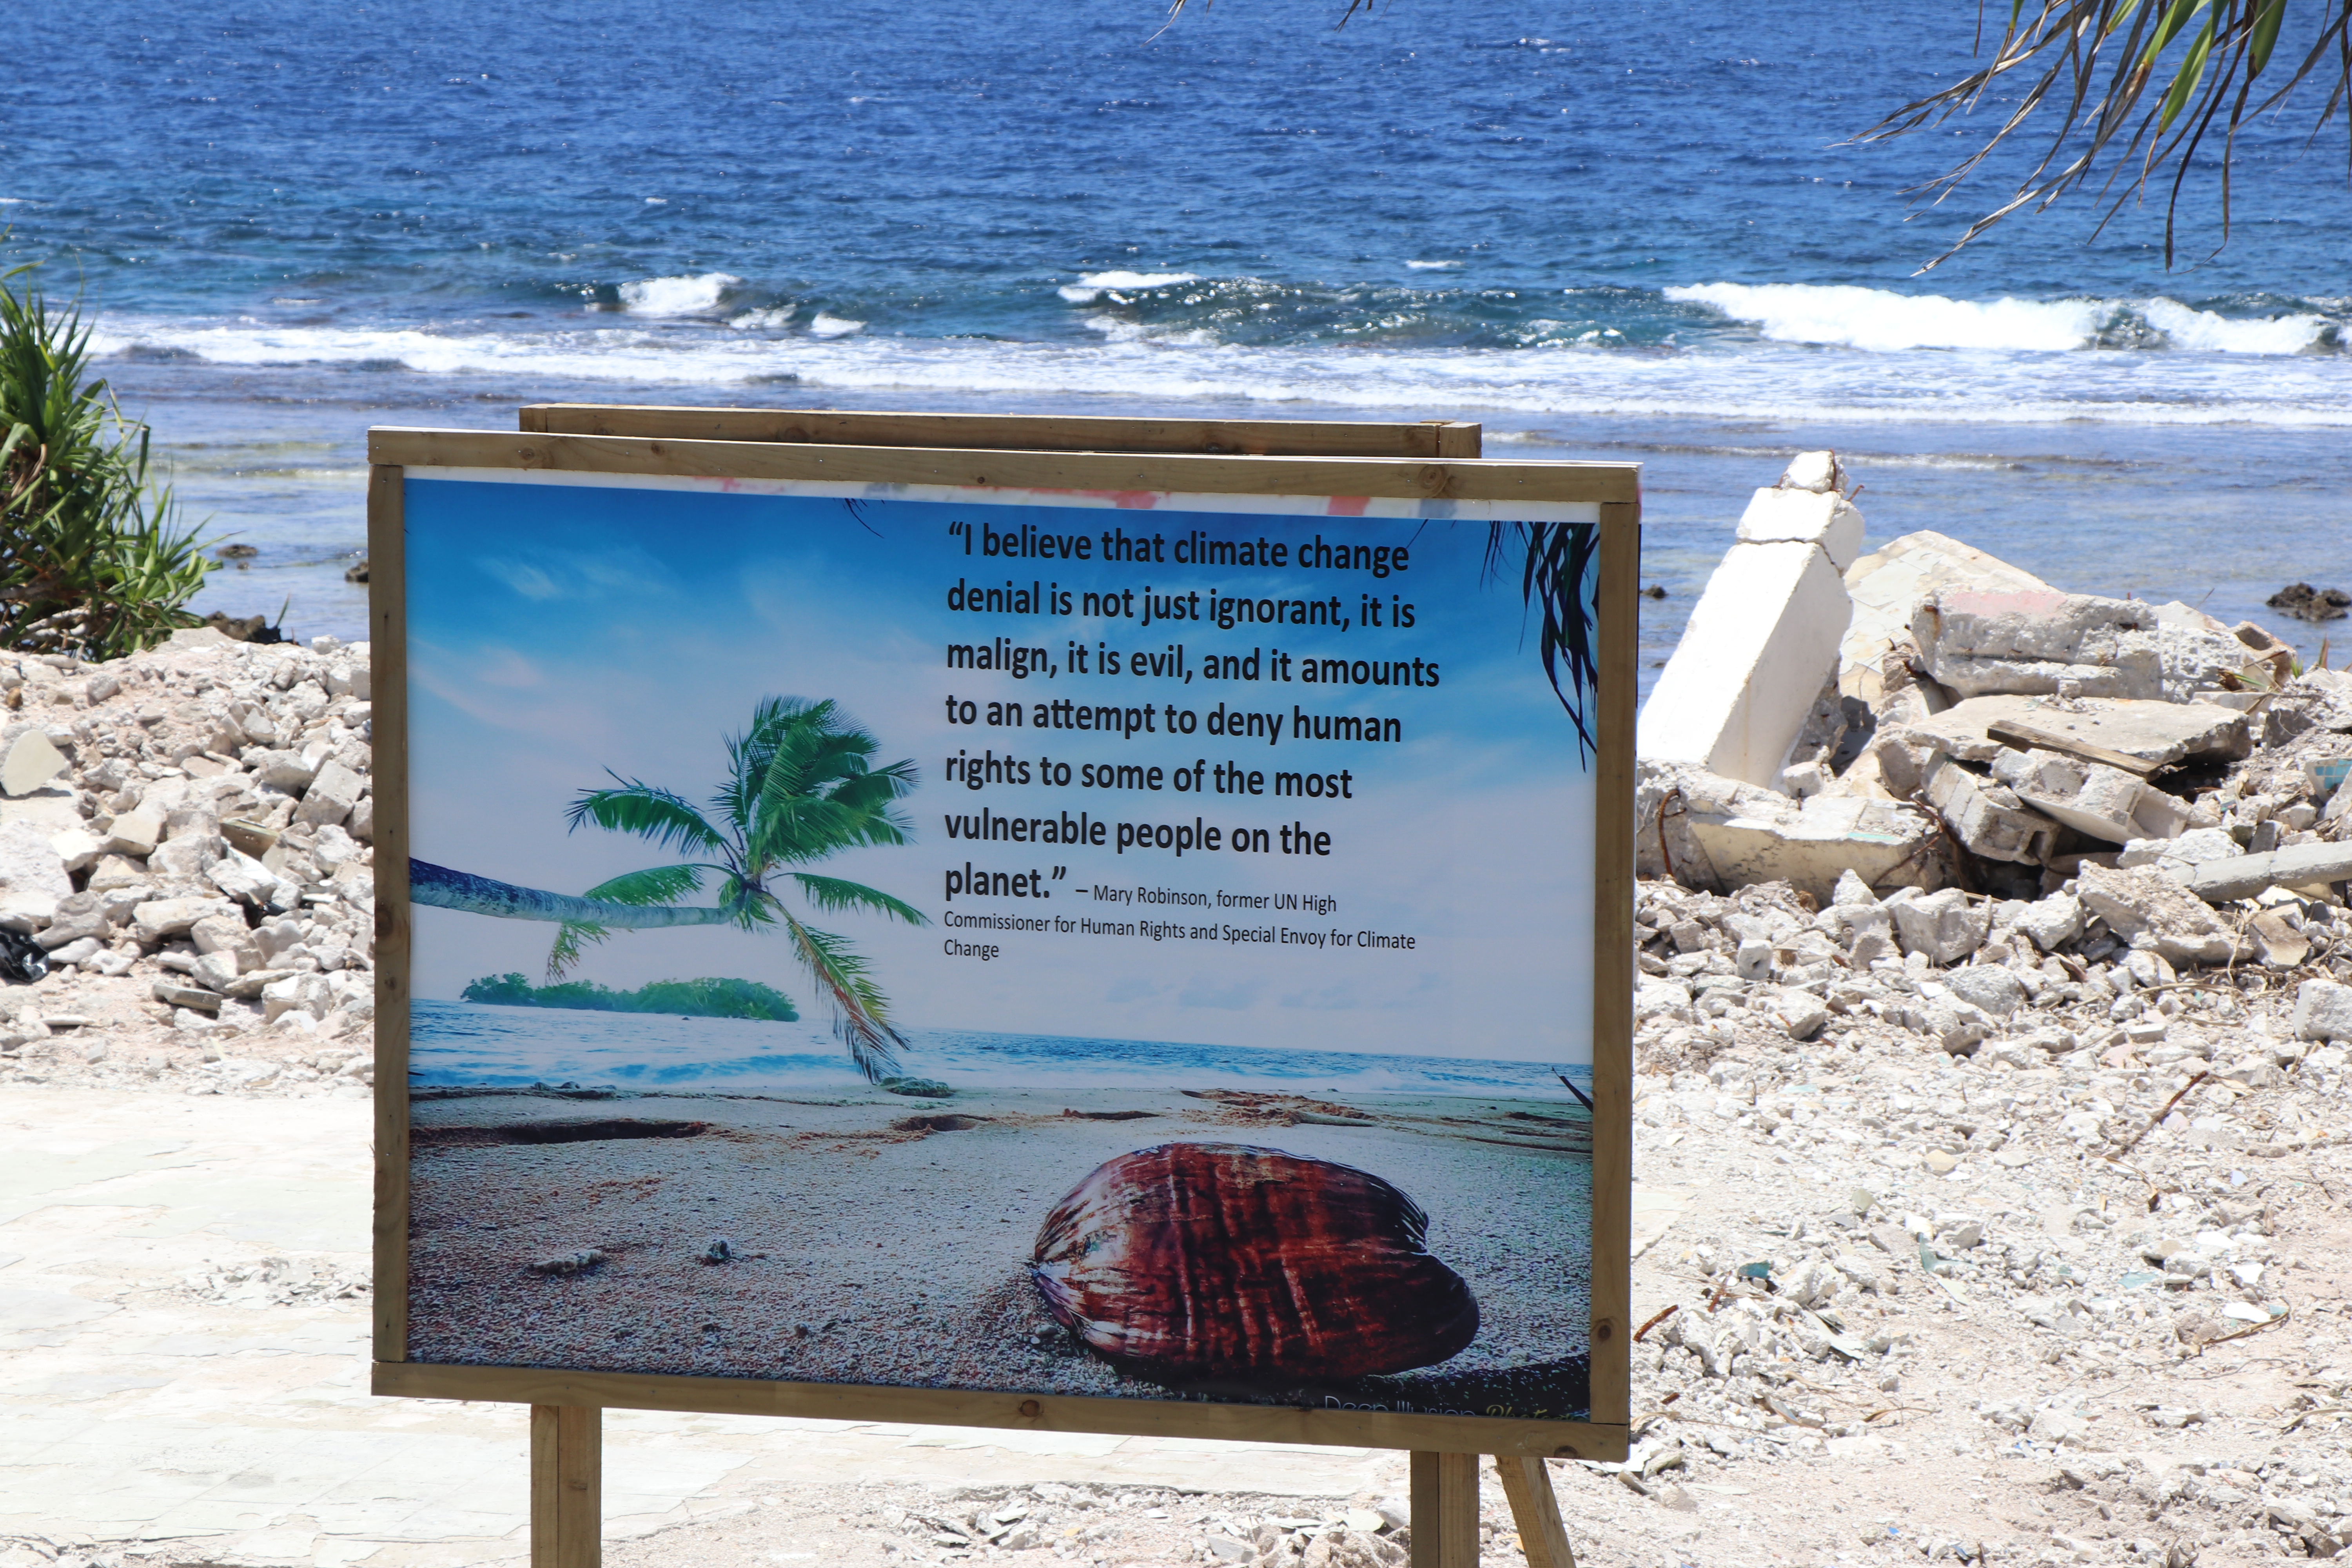
Tuvalu is one of the world’s most vulnerable countries to the impacts of climate change due to being extremely low-lying (the average elevation of all islands is only about 1 m above sea level), relying on the collection of rainfall for freshwater for drinking and household use, and having an economy based largely on the exploitation of natural resources that are vulnerable to changing climate conditions (commercial fisheries).
Key | |
2021 onwards | Projected values |
A total of 83 Invasive Alien Species (IAS) are found in Tuvalu, comprising 14 animal species, 68 plant species, and one virus (banana bunchy top virus). To date, no management plans have been produced for controlling or eradicating invasive alien species, and no sites are managed specifically for IAS.
IAS generate a wide range of impacts, including on native biodiversity (through competing with, predating on, or modifying the habitat of native species), the economy (including through negative impacts on agriculture and fisheries production), and human health and well-being (Global Environment Facility 2017)
“sediments on Fongafale’s lagoon coast had 2.7x10⁴ more microbial biomass, significantly different microbial community structure, and low microbial diversity, when compared to an undisturbed natural coastal sediment, indicating that pollution of this site is chronic”. Fujita et al. (2013).
Risk of illness associated with Microbial Assessment Categories | ||
Category | Enterococci (cfu/100mL) | Illness risk* |
---|---|---|
A | <=40 | GI illness risk: <1% |
AFG illness risk: <0.3% | ||
B | 41-200 | GI illness risk: 1-5% |
AFG illness risk: 0.3-1.9% | ||
C | 201-500 | GI illness risk: 5-10% |
AFG illness risk: 1.9-3.9% | ||
D | >500 | GI illness risk: >10% |
AFG illness risk: >3.9% | ||
* GI = gastrointestinal illness; AFR = acute fever and rash |
Source: Australian Government Guidelines for Managing Risks in Recreation Water (2008)
It estimated that in 2014 each household in Funafuti generated 23 kg of waste per week (or 0.37 kg/person/ day). The 2017 waste survey report estimated Tuvalu’s daily waste generation at 0.42 kg per person per day – 60% green waste, 15% nappies, 7% plastics, 5% paper, 4% metals and glass, 2% textiles, and 3% other. The 2019 Tuvalu Waste Audit reported that households on Funafuti generate 1,144 kg of waste per day, and other sources (such as commercial premises) generate 1,760 kg per day, giving a total daily waste generation of 2,904 kg. Although no data is currently available for Funafuti’s population in 2019, if we assume an annual growth rate of 3% (as was observed between 2012 and 2017), we can estimate it at 6,705 persons. This would represent a per capita daily waste generation of 0.43 kg.
Tuvalu’s current rate of per capita waste generation is well below both the global average (0.74 kg/person/day, according to the 2018 World Bank report What a Waste: A Global Review of Solid Waste Management. The rate of MSW generation is problematic for Tuvalu due to the nation’s limited availability of land for waste disposal, and limited capacity for processing or recycling waste in-country. Tuvalu is seeking to reduce rates of waste generation and improve waste management through implementing the priority actions defined by the Tuvalu Integrated Waste Policy and Action Plan, including:
The Tuvalu State of Environment Report 2022 was led and developed by the Government of Tuvalu through the Department of Environment and the Secretariat of the Pacific Regional Environment Programme (SPREP). Financial and coordination support was provided by GEF, UNEP and SPREP.
Web design and development by Aeski & Eighty Options Pty Ltd
A growing number of data portals, knowledge libraries, and communication materials are available to support Pacific environmental management. The following are external links to the major environmental information resources.